
Positive trends and strong fundamentals seemed to be on the side of the three alts XRP, DASH and Compound. Moving averages favored a bullish trend for XRP. DASH too was favored by the buying sentiment, as a bullish rectangle pattern started to emerge on its daily chart.
Compound, on the other hand, displayed low levels of volatility. Despite this, an uptrend for the digital asset was still visible from one of its technical indicators.
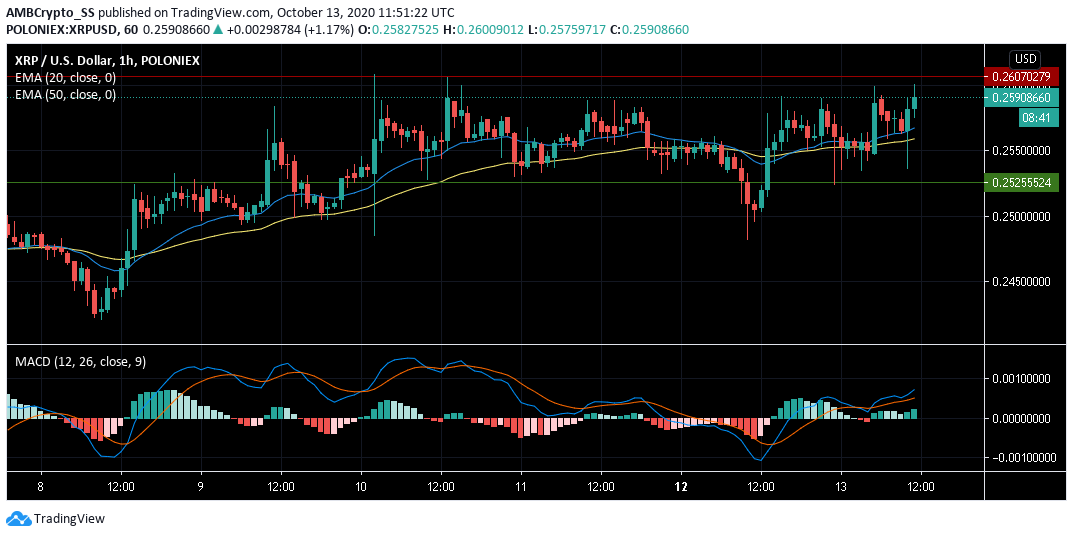
Since the last 24 hours, XRP has risen by almost 3%, trading just below its immediate resistance of $ 0.260.
XRP was further able to maintain its price above its 20 and 50-period exponential Moving Averages, with the 20 EMA (blue) above the 50 EMA (yellow) -a clear sign of bullish momentum
Further indicating a withdrawal by the bears, was signaled by the bullishness visible from the MACD line rising above the signal line. The upward price trend indicated by the EMA and MACD suggested a bullish control of the $ 0.2607 resistance could be possible over the next few days.
In other news, a recent survey of XRP investors claimed that 72.4% of them believed that the cryptocurrency could potentially reach $100 in the future. While a third said, a $5 level could be breached by the year-end.
DASH
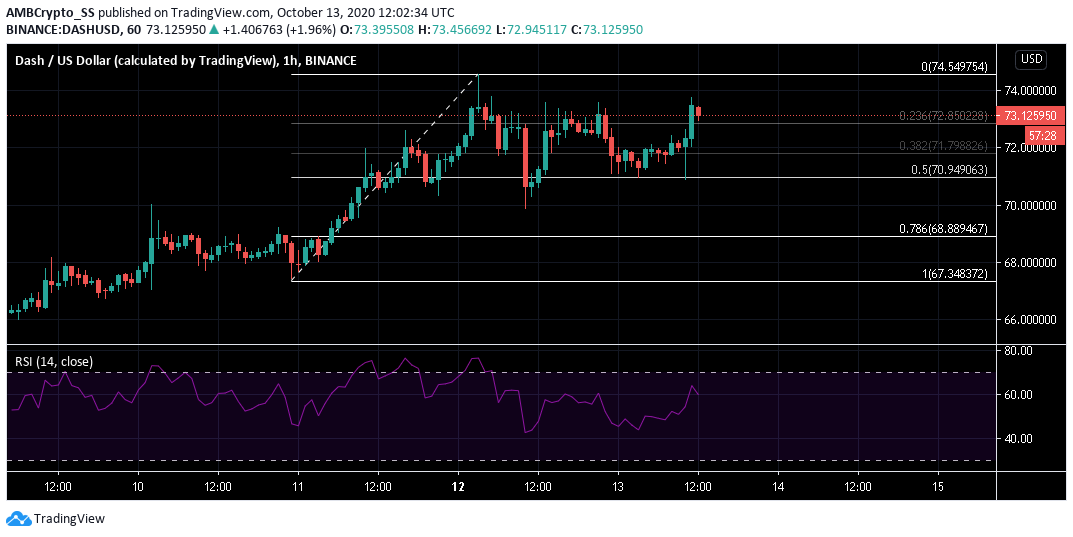
DASH jumped 2.55% above the Fibonacci retracement region on the daily charts.
The price chart could be seen repeating earlier trends and hinted towards the formation of a bullish rectangle pattern.
The same was also confirmed from the Relative Strength Index (RSI), which recorded a downturn, indicating the possibility of the short correction towards the support level.
This meant a retest of the 50% region or the $ 0.949 level of support, could lead to another rally of upward price movement, following the indications from the bullish rectangle pattern and RSI movements.
Compound [COMP]
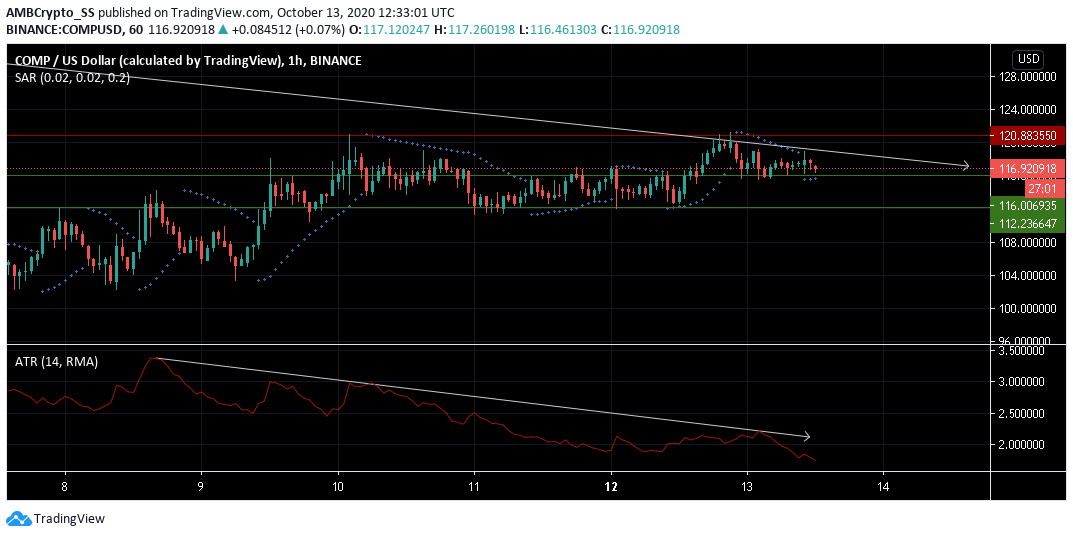
While the Average True Range noted a consistent dip in the levels of volatility since 10 October, a sideways price movement for the Compound market was also visible for the same duration.
Although the digital asset, still managed to breach two of its immediate supports in the last 24 hours, signaling a comeback of buying pressure, despite low volatility levels.
Strong fundamentals along with buyer’s control over the COMP market could be the potential reasons.
The dotted lines of the Parabolic SAR below the candles also hinted towards an upward price trend for the upcoming trading sessions. However, a reversal was not certain given the low levels of volatilities.
The post appeared first on AMBCrypto


