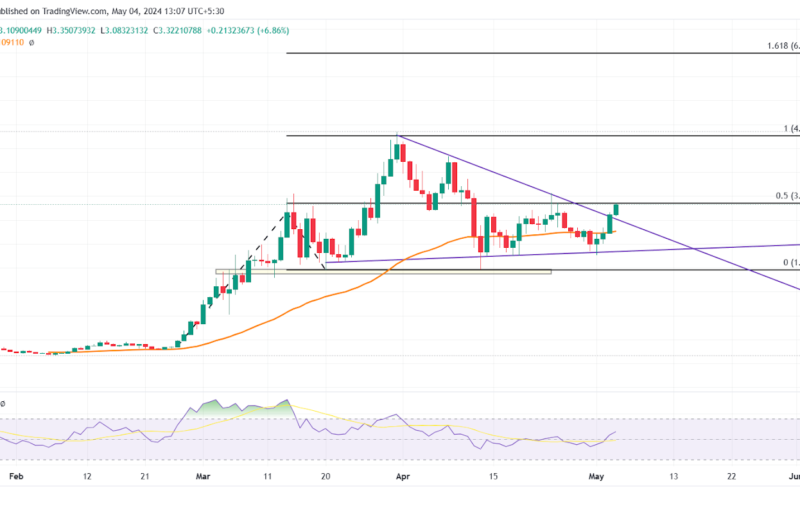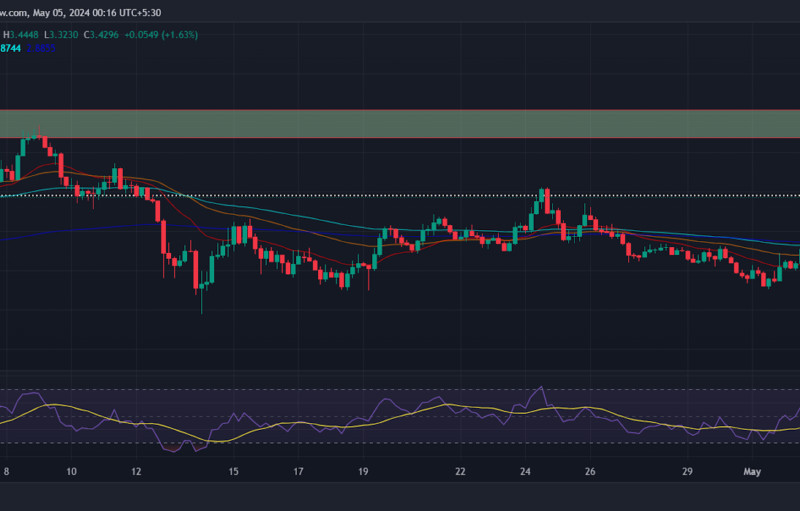
It’s a bullish start to the day for the major cryptocurrencies. Steering clear of the day’s pivot levels would bring resistance levels into play. Overall, the crypto’s price is currently caught within a holding pattern with defi tokens like LINK, SUSHI, and YFI price showing massive gains.
On December 23rd Bitcoin price successfully surpassed Yearn.Finance and was the highest valued crypto. YFI is currently trading at $21,780 after a significant rebound from the low of $18,000.
YFI Price Might Plunge Before Massive Surge!
At press time yearn.finance price is trading at $23,963.51 with a 24-hour trading volume of $460,479,791 USD. YFI is up 21.28% in the last 24 hours. The current CoinMarketCap ranking is #37, with a market cap of $718,139,313.
As we can see the exchange inflow of YFI coins has spiked again, Large investors are eagerly waiting for the YFI price to dip lower before starting to buy. This indicates that the defi token price is poised for a plunge before a massive surge.
Previously, in the month of November, we saw similar behavior that resulted in whales buying the dip. As per the 4-hour and 12-hour charts, the TD Sequential indicator has just presented two buy signals simultaneously, giving a lot of credence to the bullish outlook.
Analysts believe that Yearn.finance’s current technical structure is similar to that of Ethereum’s in late-2016. If history rhymes and YFI sees a similar breakout in the coming days, there’s a strong possibility that the token could enter another price discovery phase that results in it seeing some parabolic momentum.
BTC Price Struggles Within $24,000 Range, Could Trigger on the Upside Soon
BTC is displaying steady performance. At press time Bitcoin price is $23,671.46 USD with a 24-hour trading volume of $36,382,424,119 USD. Bitcoin is up 3.14% in the last 24 hours.
Also Read : What Bitcoin Price Will Look Like in 2021?
In the past two sessions, bitcoin saw a bullish move above the USD 23,000 level. BTC climbed higher above the USD 23,200 and USD 23,500 resistance levels. It is currently showing positive signs, but there are still many key hurdles on the upside near USD 23,880 and USD 24,000.
On the downside, the first major support is near the USD 23,200 level. The next major support is near the USD 23,000 level, below which the price could revisit the USD 22,700 region.
As per the BTC/USD price 4Hour chart the next possible resistance level could be at $24300. Further, the next notable price spot is $26127.84. However, it looks that the Bitcoin price is facing minor resistance to the upside and it is on the path of the $30K mark.
At present , it seems that odds support the bulls in the short and long-terms. Most technical indicators are already massively bullish on virtually all time-frames.
The post appeared first on Coinpedia


