
Bitcoin price failed to extend gains above $7,700 and declined more than $400 against the US Dollar.The price is now trading below $7,400 and it declined close to the $7,260 support area.Earlier, there was a break below a contacting triangle with support near $7,500 on the hourly chart of the BTC/USD pair (data feed from Kraken).The pair must stay above the $7,120 support to avoid a bearish reversal in the near term.Bitcoin price is back to the key $7,200 support area against the US Dollar. BTC is now facing a lot of hurdles near the $7,400 and $7,500 levels.Bitcoin Price AnalysisYesterday, we saw a strong rise in bitcoin price above the $7,500 resistance against the US Dollar. Moreover, the price spiked above the $7,600 level and the 100 hourly simple moving average.However, the bulls struggled to gain traction above the $7,680 and $7,700 levels. There were two attempts to pierce the $7,700 resistance, but the bears succeeded in defending more upsides.As a result, there was a fresh decline below the $7,500 support and the $7,400 pivot. Besides, there was a break below a contacting triangle with support near $7,500 on the hourly chart of the BTC/USD pair.Bitcoin price is down more than $400 and it even traded below the $7,320 support. Finally, it traded close to the $7,260 support and a low is formed near $7,267.BTC surpassed a few key hurdles near $7,300 and $7,400 to start a strong upward move. It seems like the $7,200 support area is very important along with the 100 hourly simple moving average.On the upside, an initial resistance is near the $7,360 level. It is close to the 23.6% Fib retracement level of the recent decline from the $7,686 high to $7,267 low.However, the first major resistance is near the $7,480 and $7,500 levels. Additionally, the 50% Fib retracement level of the recent decline from the $7,686 high to $7,267 low is at $7,477.Therefore, bitcoin must surpass the $7,400 and $7,500 resistance levels to revisit the main $7,700 resistance area. On the downside, the $7,260 and $7,200 levels hold the key. The next major support is near $7,120, below which the price could start a sharp decline.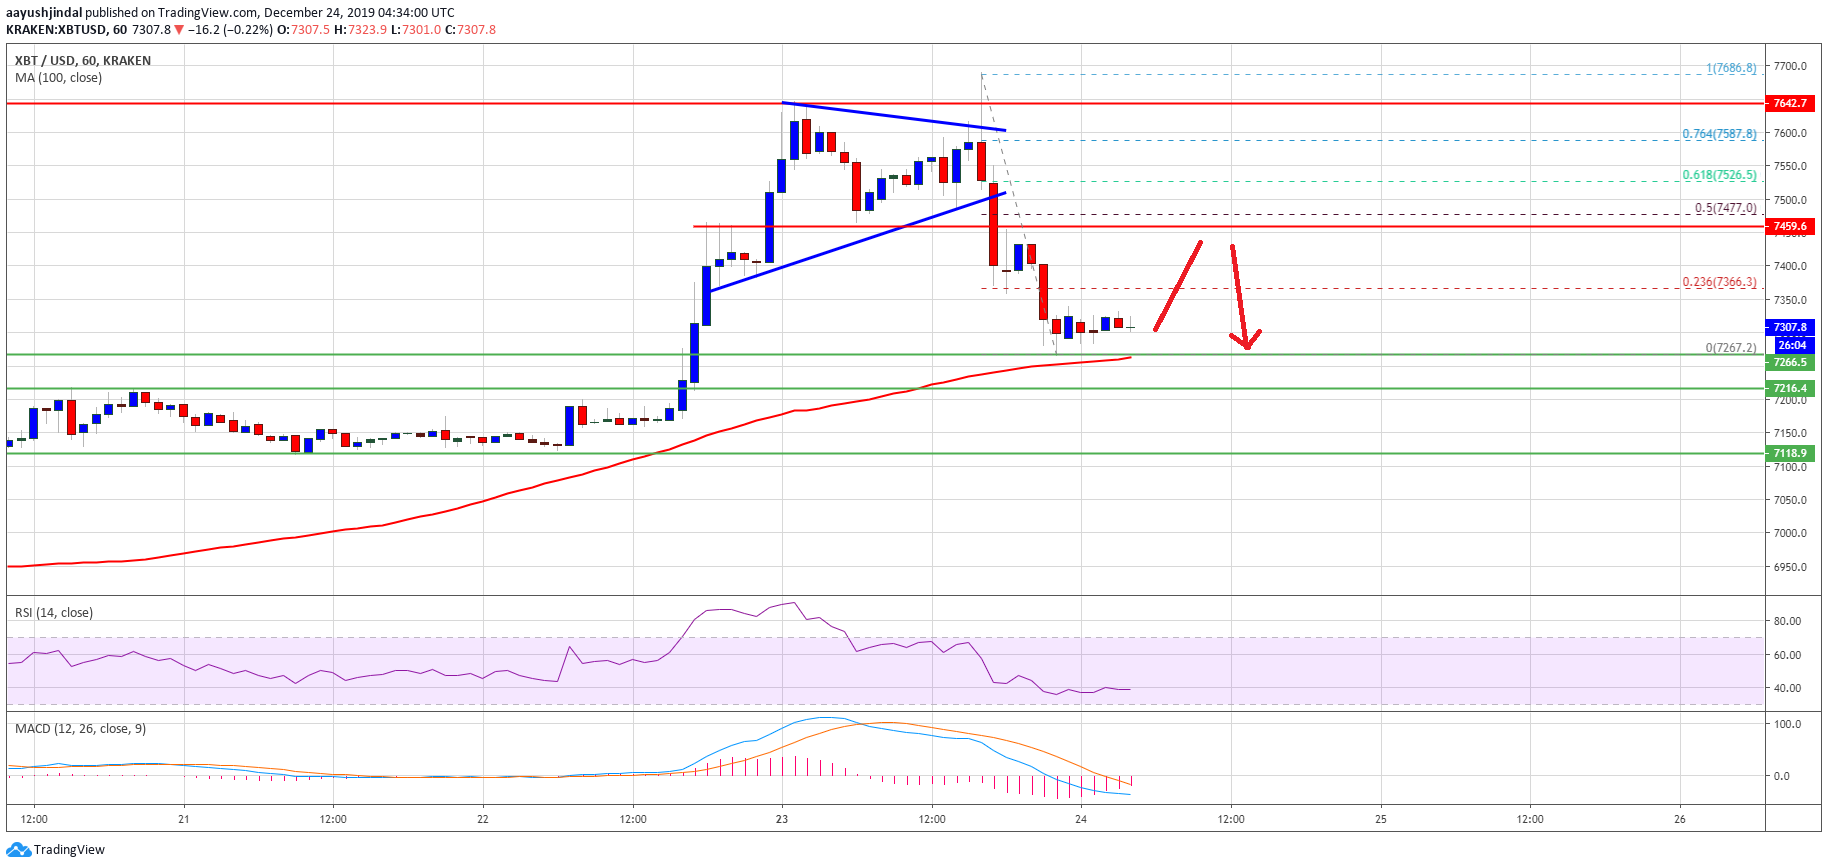 Bitcoin PriceLooking at the chart, bitcoin price is under pressure below $7,400 and $7,500. Having said that, the bulls are likely to bounce back as long as the price is above $7,120.Technical indicators:Hourly MACD – The MACD is slowly reducing its bearish slope.Hourly RSI (Relative Strength Index) – The RSI for BTC/USD is slowly moving higher towards 40.Major Support Levels – $7,260 followed by $7,120.Major Resistance Levels – $7,360, $7,480 and $7,500.The post appeared first on NewsBTC


