
Ripple price is still struggling to gain momentum and declining below $0.1920 against the US dollar.Yesterday, XRP failed to rise substantially, while bitcoin and Ethereum climbed more than 5%.Recently, there was a break below a major bullish trend line with support near $0.1955 on the hourly chart of the XRP/USD pair (data source from Kraken).There is a risk of more downsides below the $0.1900 support levels in the near term.Ripple price is showing bearish signs below $0.1920 against the US Dollar, while BTC and ETH are down 4%. XRP price might decline further towards the $0.1850 support.Ripple Price AnalysisYesterday, there was a solid increase in bitcoin and Ethereum, but ripple price failed to gain momentum against the US Dollar. It seems like XRP’s failure to gain strength was a warning sign that BTC and ETH might also struggle to continue higher.Recently, both BTC and ETH declined around 5% and trimmed most gains. Ripple also started a fresh decline after it failed to surpass the main $0.2000 resistance area.A swing high was formed near $0.1986 before the price declined below $0.1950. Moreover, there was a break below a major bullish trend line with support near $0.1955 on the hourly chart of the XRP/USD pair.The price is now trading well below the $0.1950 level and the 100 hourly simple moving average. Besides, it broke the $0.1920 support and traded close to $0.1880. A low is formed near $0.1884 and the price is currently consolidating.It climbed above the 23.6% Fib retracement level of the recent decline from the $0.1986 high to $0.1884 low. An initial hurdle is near the $0.1925 and the 100 hourly SMA.The first key resistance is near the $0.1950 level and a connecting bearish trend line on the same chart. Additionally, the 50% Fib retracement level of the recent decline from the $0.1986 high to $0.1884 low is near the $0.1935 level.Therefore, an upside break above $0.1935 and $0.1950 is needed for a decent upward move. The main resistance is still near $0.2000, above which the price could move into a positive zone.On the downside, an initial support is near $0.1900 and $0.1880, below which there is a risk of more losses below $0.1850 and $0.1820.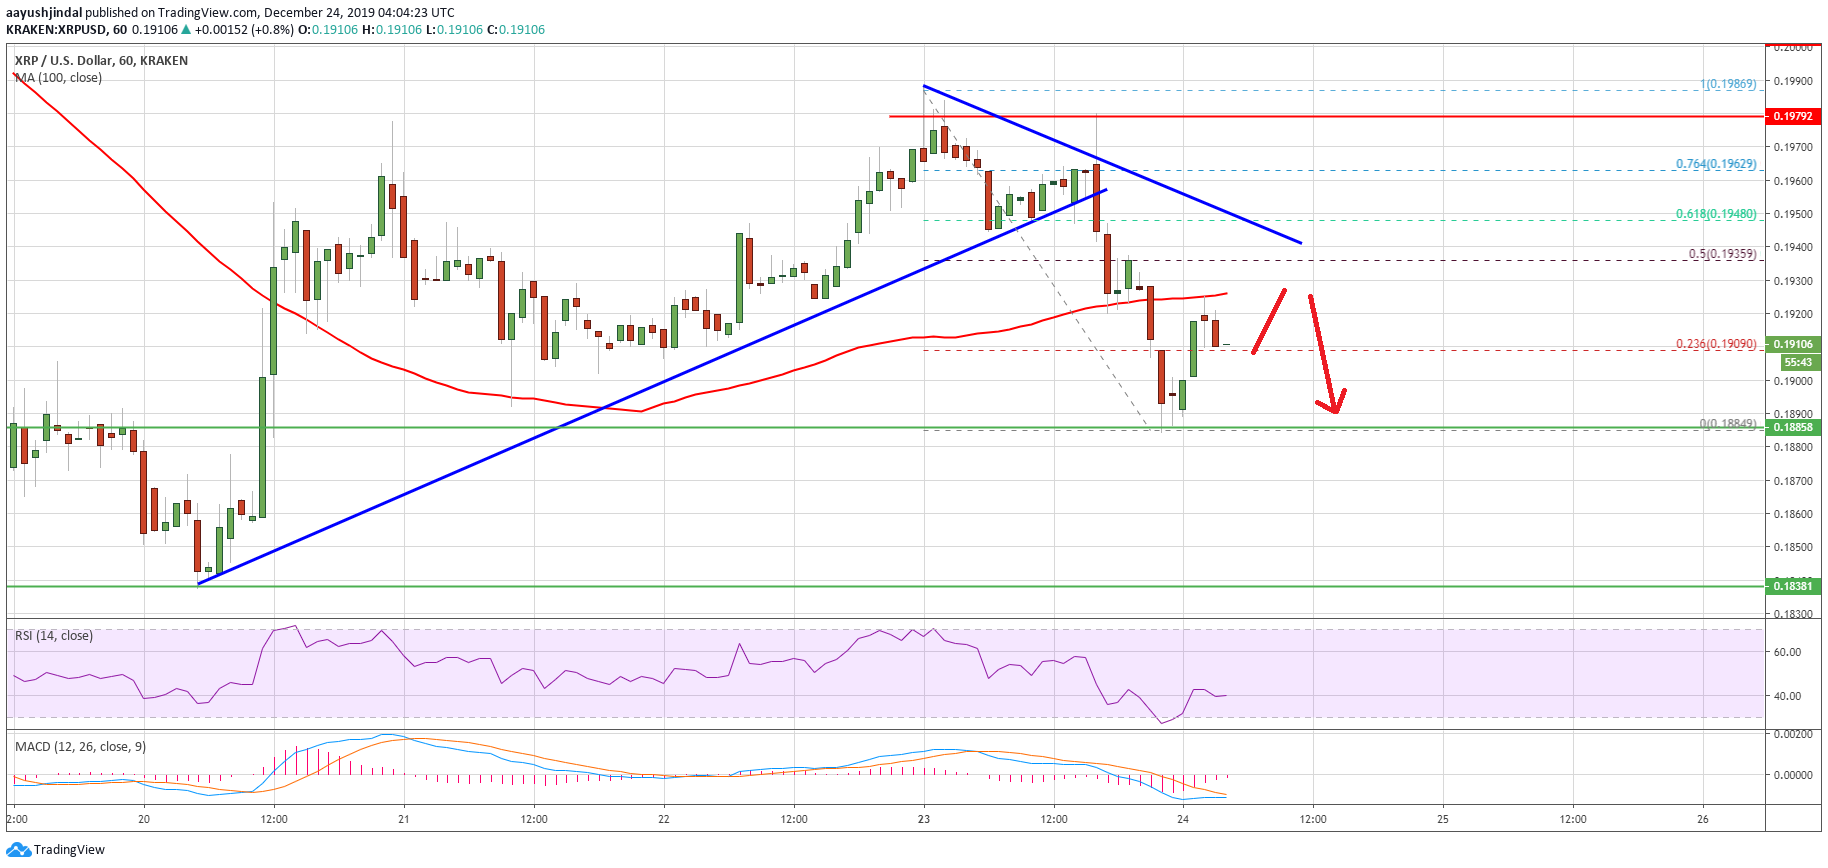 Ripple PriceLooking at the chart, ripple price is showing bearish signs below $0.1950 and it could decline further if both bitcoin and Ethereum continue to slide in the near term.Technical IndicatorsHourly MACD – The MACD for XRP/USD is slowly moving into the bullish zone.Hourly RSI (Relative Strength Index) – The RSI for XRP/USD is now just above 40, with a flat structure.Major Support Levels – $0.1900, $0.1880 and $0.1850.Major Resistance Levels – $0.1935, $0.1950 and $0.2000.The post appeared first on NewsBTC


