
- Ethereum went through a 3% price increase over the past 24 hours after rebounding from support at the 100-days EMA.
- Against BTC, ETH has turned away from the resistance at the 100-days EMA and looks to trend lower with a bearish crossover signal on the Stochastic RSI.
- Ethereum has survived from dropping beneath the $158 level as it looks to re-test the 200-days EMA at $173.
Key Support & Resistance Levels
Support: $165, $158, $145, $133.50.
Resistance: $174, $181, $186, $193.50.
Support: 0.0191 BTC, 0.019 BTC, 0.0188 BTC, 0.0185 BTC.
Resistance: 0.0195 BTC, 0.020 BTC, 0.0204 BTC.
ETH/USD: ETH Rebounds From .382 Fib Support, Will We Break The 200-Days EMA On The Re-Test?
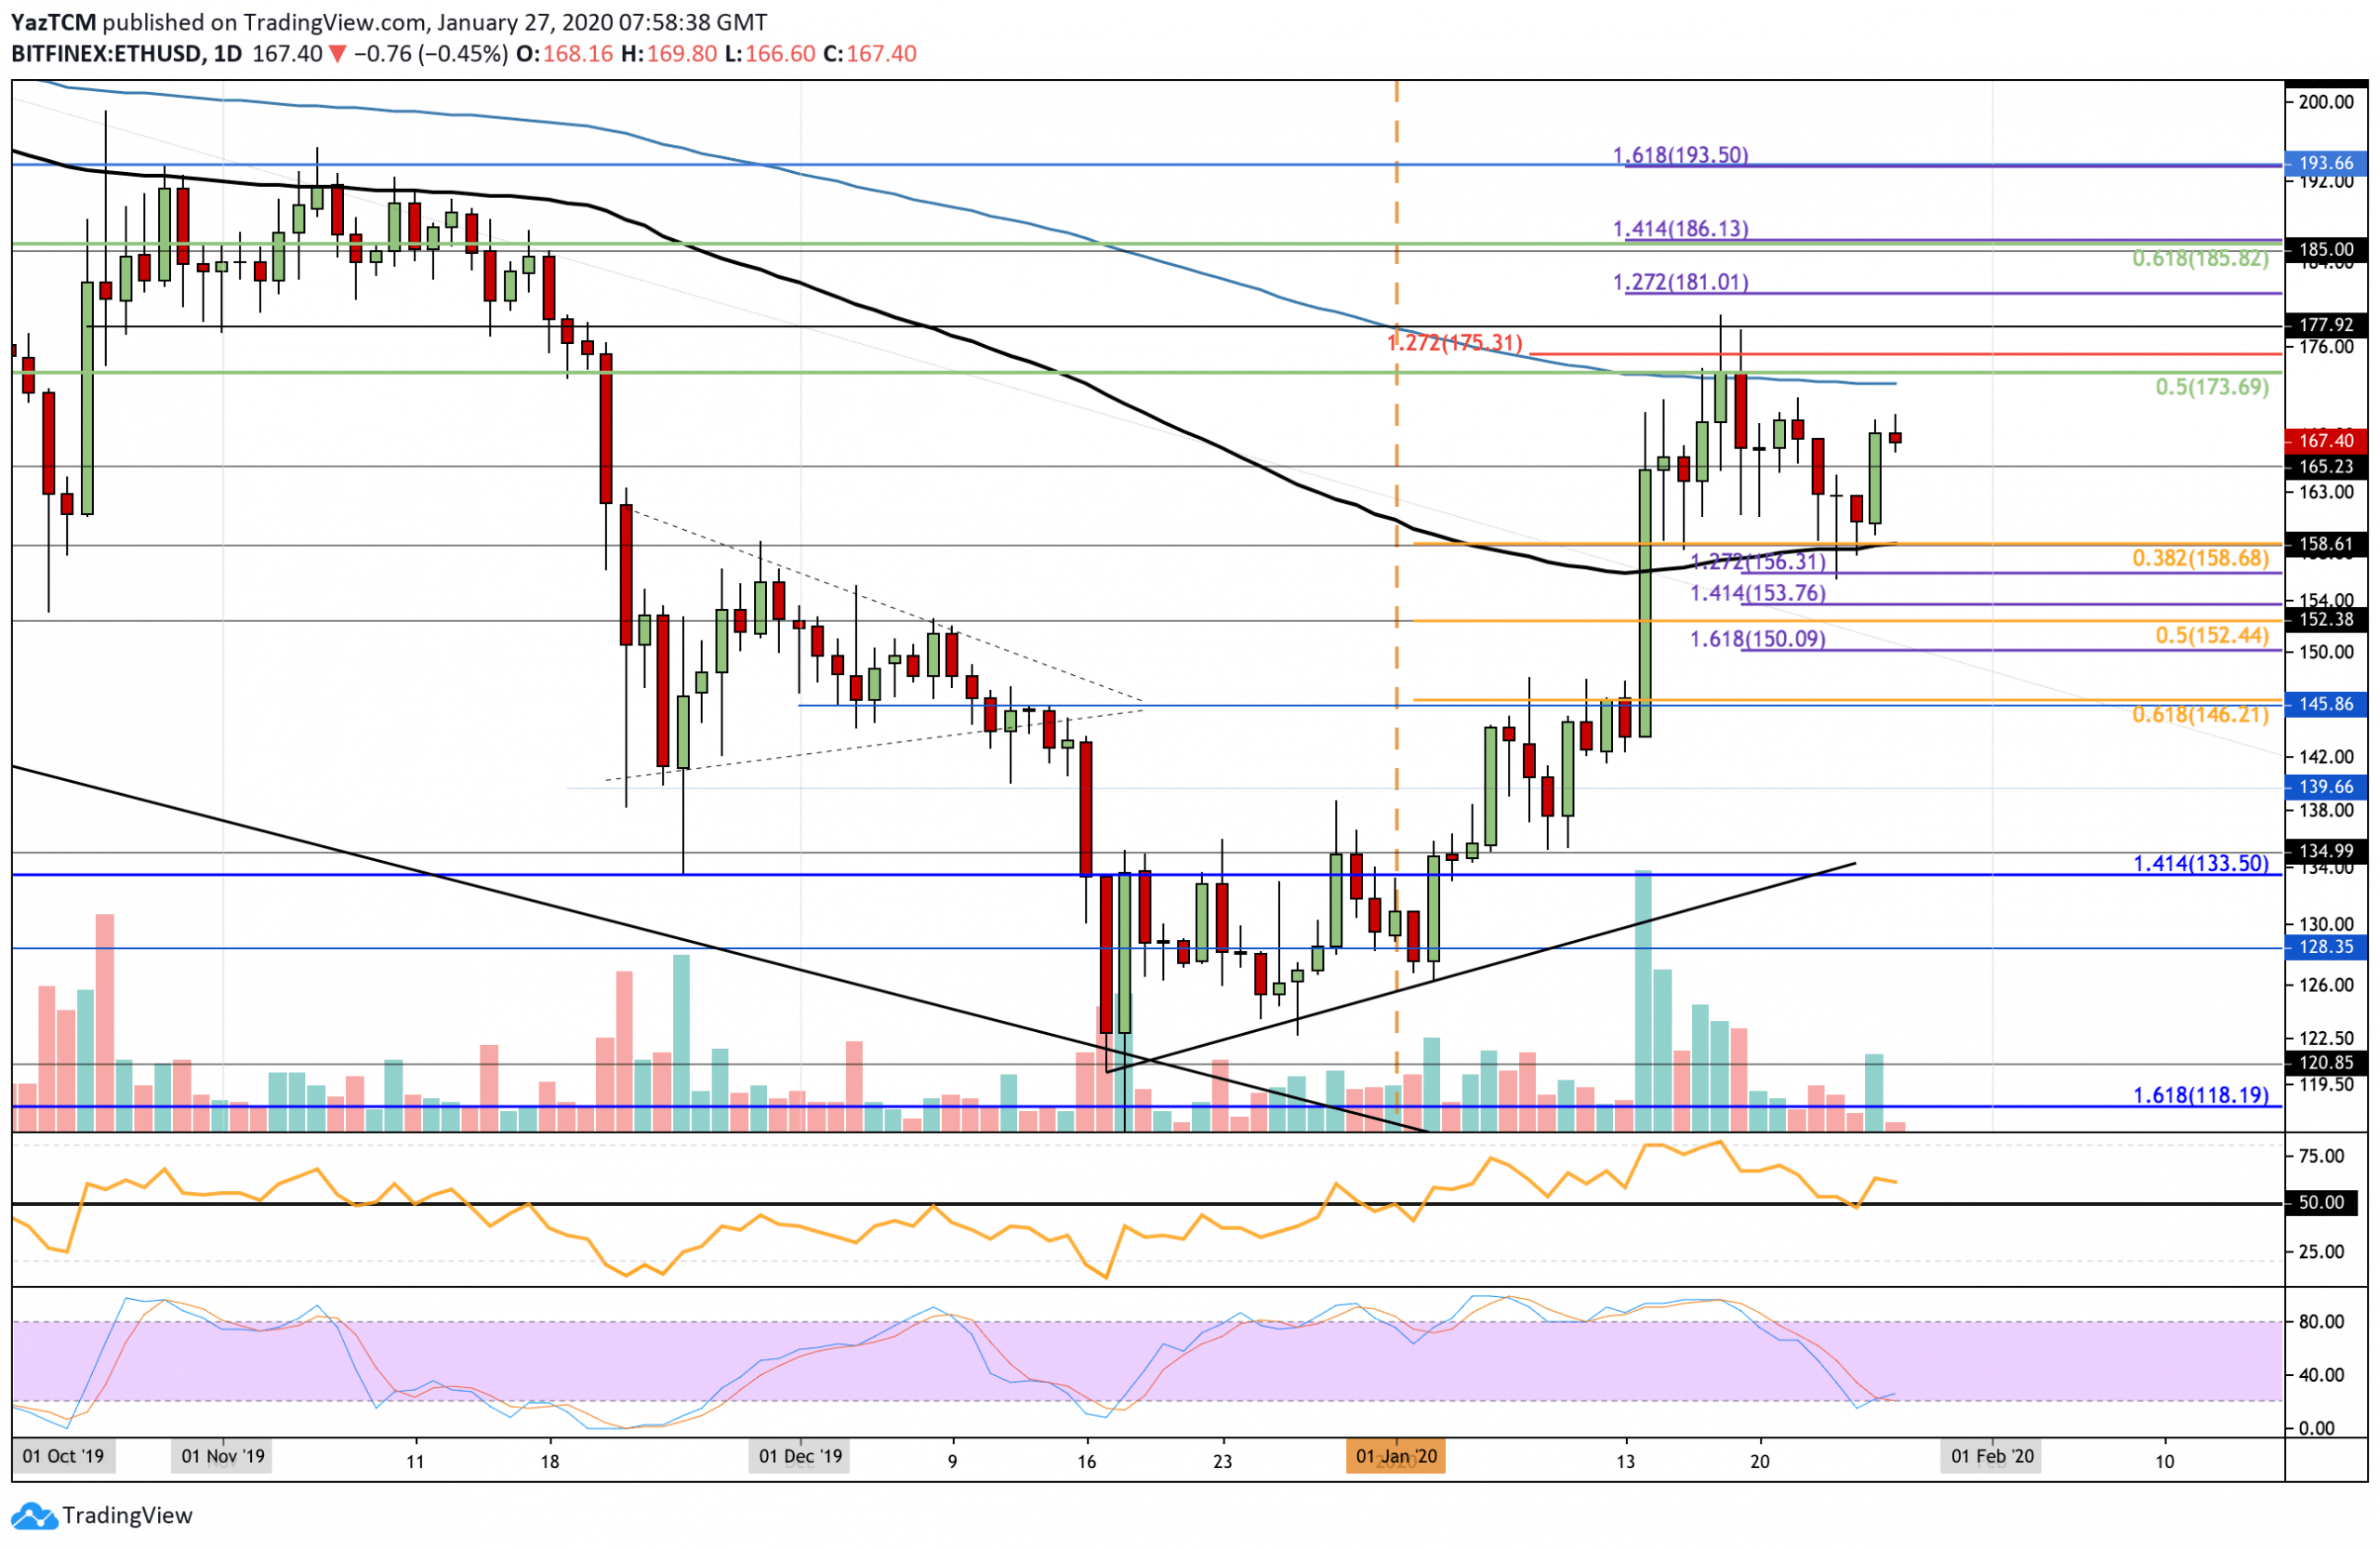
Since our last analysis, ETH rebounded from the support provided by the 100-days EMA and the short term .382 Fibonacci Retracement level. This has prevented it from sliding into a short term bearish trend as it looks to turn bullish with a break above the 200-days EMA at $173. Before this can happen, Ethereum must break above resistance at $170.
Ethereum remains in a short term bullish condition after rebounding from the 100-days EMA support. For this bullish trend to extend over the next few weeks, ETH must break the resistance at the 100-days EMA and clear the January high at $178. If ETH were to drop beneath $158, it would turn neutral with a further drop beneath $145, turning the market bearish once again.
Ethereum Short Term Price Prediction
If the bulls can continue to bring Ethereum up above $170, resistance can initially be expected at $170 and then at $173, which is provided by the 200-days EMA and bolstered by the long term bearish .5 Fibonacci Retracement level. Above $174, resistance lies at $178, $181, and $185 (long term bearish .618 Fib Retracement level). On the other hand, if the sellers regroup and push Ethereum lower, support is located at $165 and $158 (100-days EMA & .382 Fib Retracement). Beneath this, support lies at $156, $152 (.5 Fib Retracement), and $146 (.618 Fib Retracement).
The RSI managed to rebound strongly at the 50 level, which is an indication that the bulls are still not ready to give up control over the market momentum. Furthermore, the Stochastic RSI recently produced a bullish crossover signal in extremely oversold conditions, which signal that a bullish push higher could be imminent.
ETH/BTC: ETH Struggles At 100-days EMA and Forms Ascending Triangle Pattern
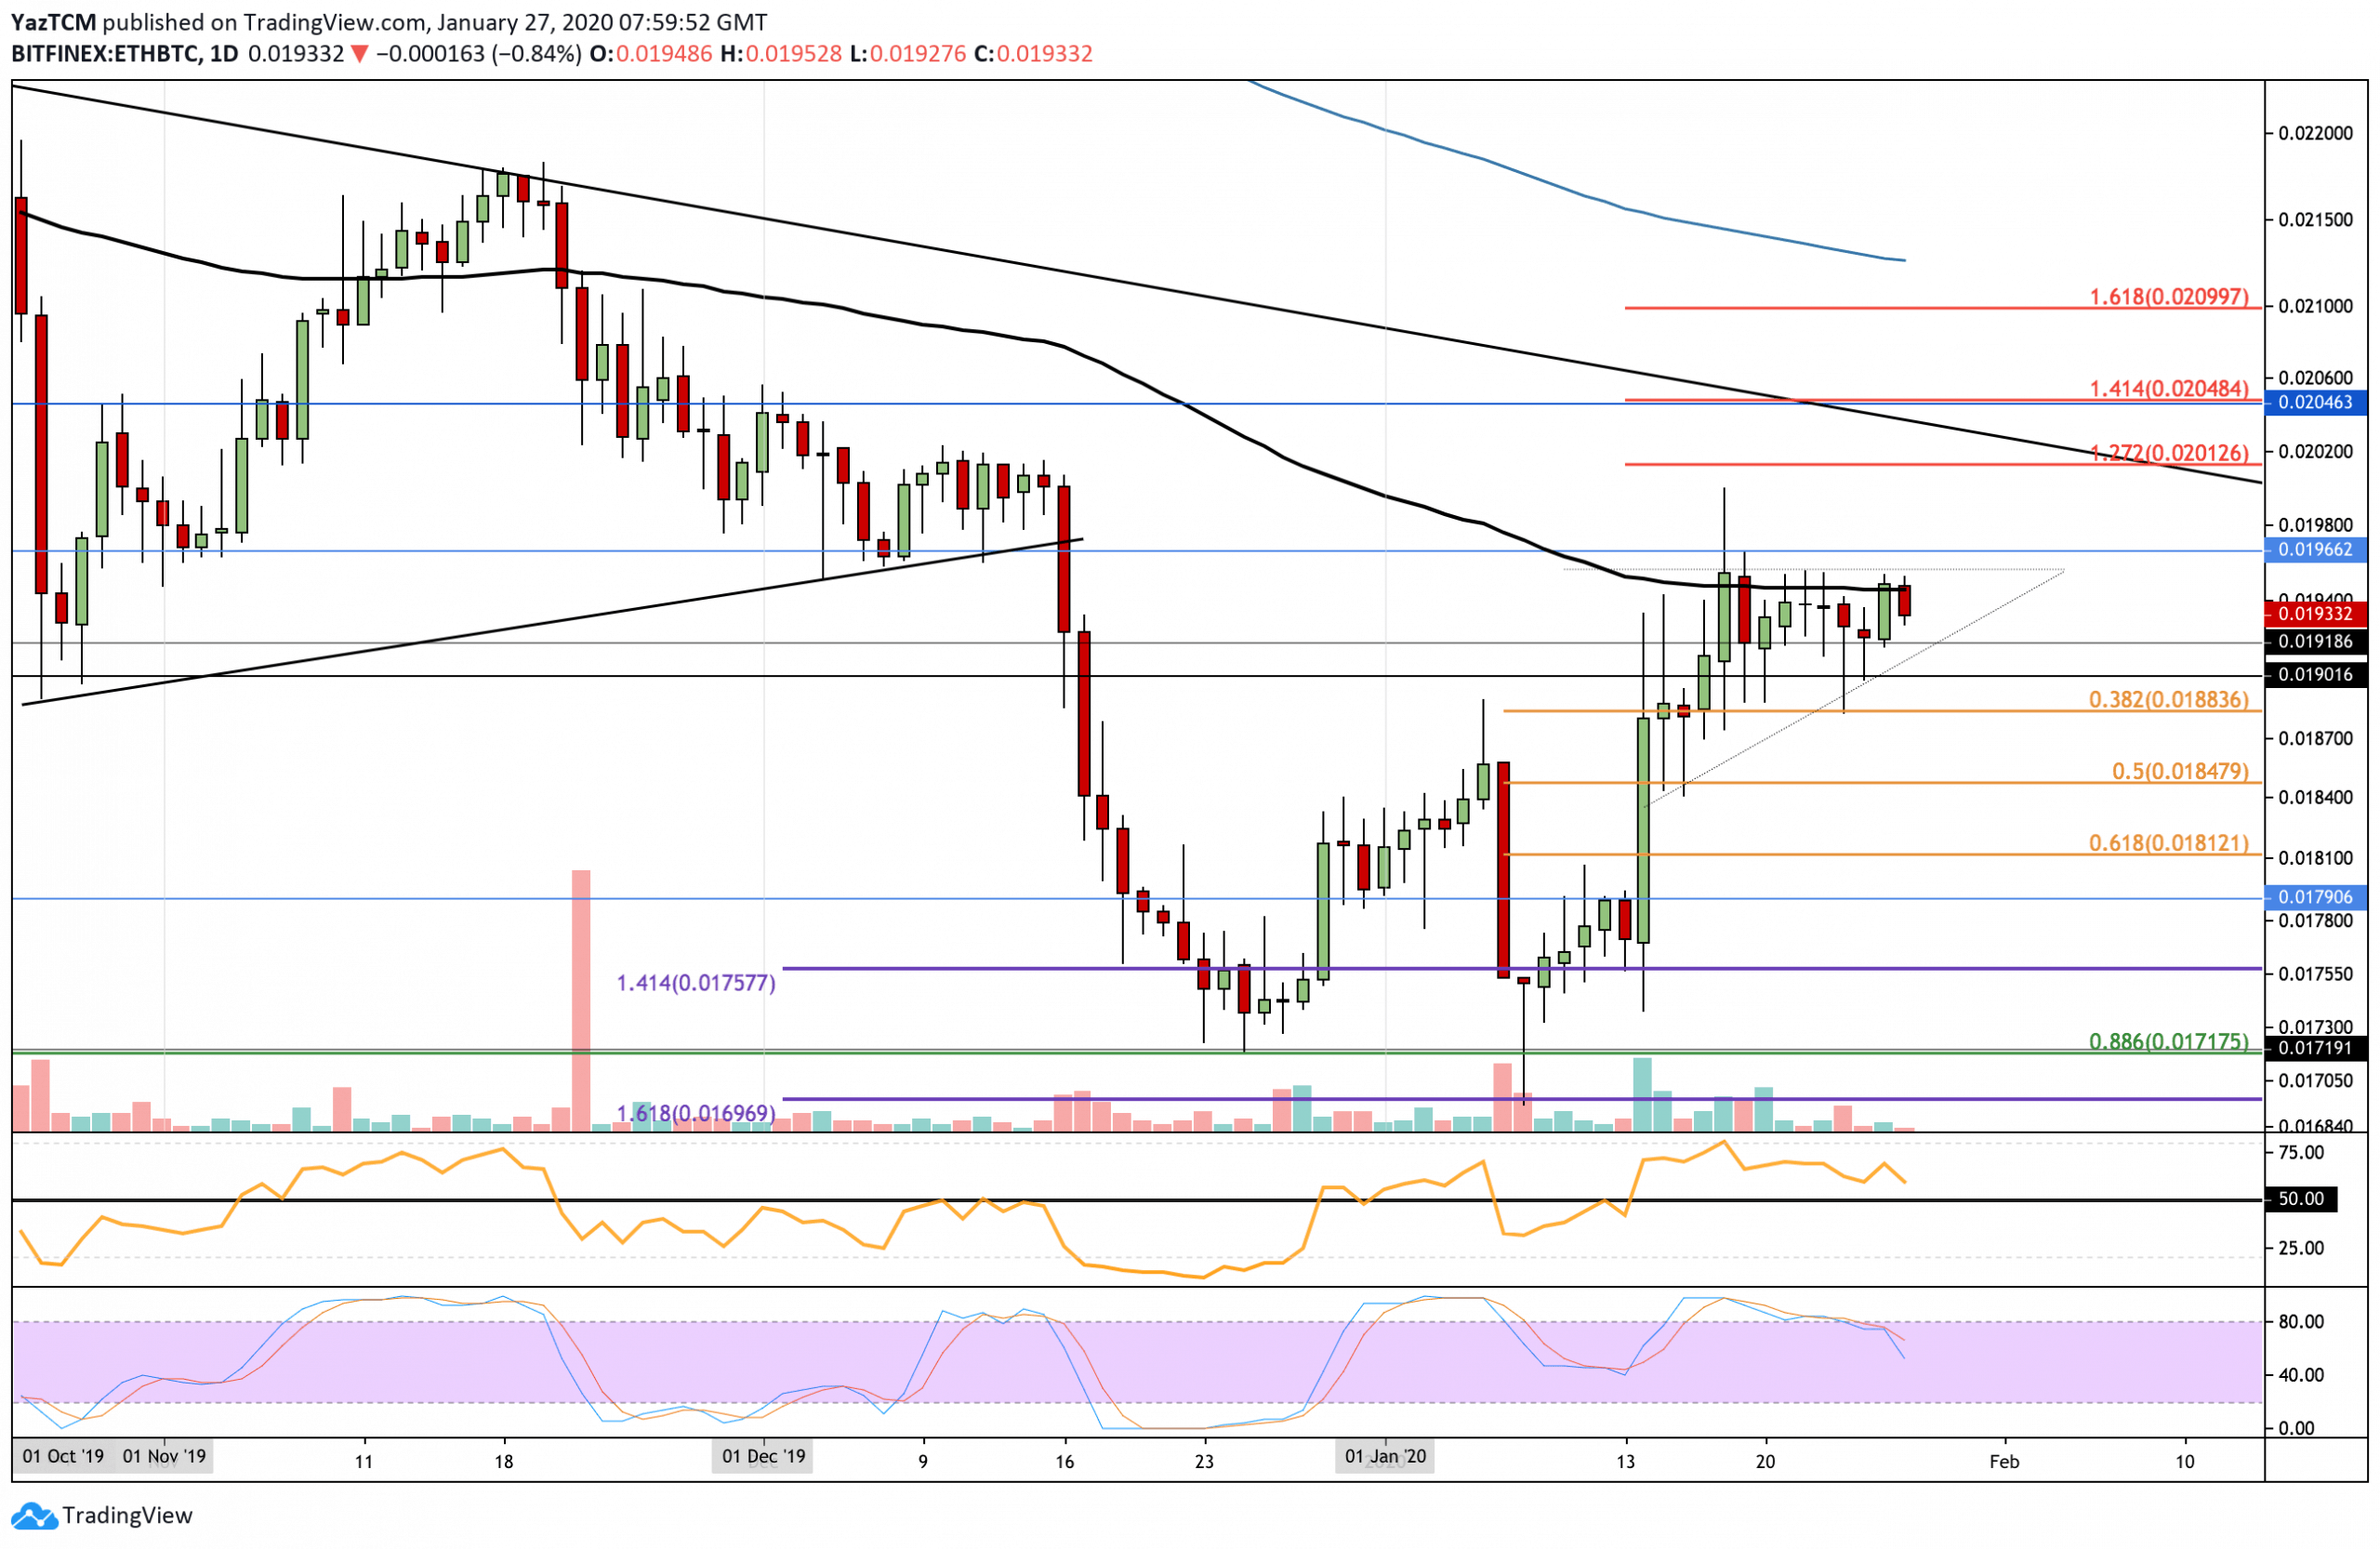
Against Bitcoin, ETH did not retrace toward the .382 Fib support as expected. Instead, it rebounded from support at 0.0191 BTC, which caused it to rise back into resistance at the 100-days EMA at around 0.0195 BTC. The cryptocurrency has been struggling with this level all month and has turned away from here again.
Ethereum is currently trapped within a period of consolidation as it trades within an ascending triangle pattern. This means that it is now neutral. To turn bullish, Ethereum must rise above the resistance at the 100-days EMA and break the upper boundary of the triangle.
Ethereum Short Term Price Prediction
If the sellers push ETH lower against BTC, the first level of support is located at 0.0191 BTC. Beneath this, support lies at 0.019 BTC (lower boundary of the triangle), 0.0188 BTC (.382 Fib Retracement), and 0.0184 BTC (.5 Fib Retracement). On the other hand, if the bulls somehow manage to break the strong resistance at the 100-days EMA, resistance above is located at 0.0196 BTC, 0.0201 BTC (1.272 Fib Extension), and 0.0204 BTC (1.414 Fib Extension).
The RSI is falling slightly but remains above the 50 level, which is a promising sign for the bulls. However, if it breaks beneath 50 during this retracement, things could get ugly for Ethereum holders. Furthermore, the Stochastic RSI recently produced a bearish crossover signal, which shows that the bullish pressure is fading.
Disclaimer: Information found on CryptoPotato is those of writers quoted. It does not represent the opinions of CryptoPotato on whether to buy, sell, or hold any investments. You are advised to conduct your own research before making any investment decisions. Use provided information at your own risk. See Disclaimer for more information.
Cryptocurrency charts by TradingView.
Technical analysis tools by Coinigy.
The post appeared first on CryptoPotato


