
This article looks into the balance of all candlesticks, specifically neutral candlesticks and how they forecast trading performance in crypto.

What is A Spinning Top?
A Spinning Top is a candlestick pattern which symbolises market indecision, with close prices close to each other and identified by its short upper and lower wicks.
What are the Indicators of a Spinning Top Pattern?
- Seek out a candlestick with a small body only.
- Validate that the candlestick is green and hence closing price > opening price (bullish) or red and hence opening price > closing price
- Verify that the top and bottom shadow has a balanced length
How to Interpret the Spinning Top Pattern?
This suggests that the fluctuations and control between the buyers and sellers in the market decide on the price outcome. The recognizable appearance of this pattern makes it accessible to beginners, providing a clear visual indication of potential trend shifts.
What is the Direction of the Spinning Top Pattern?
The body of a bullish spinning top is small, and its closing price is greater than its initial price. In this situation, the spinning top’s direction is bullish, implying that, despite some price volatility and indecision during the trading session, the buyers were able to push the price slightly higher.
Timeframes
A spinning top on a longer-term chart (such as daily or weekly) may be more significant than one on a shorter-term chart (such as intraday).
Doji
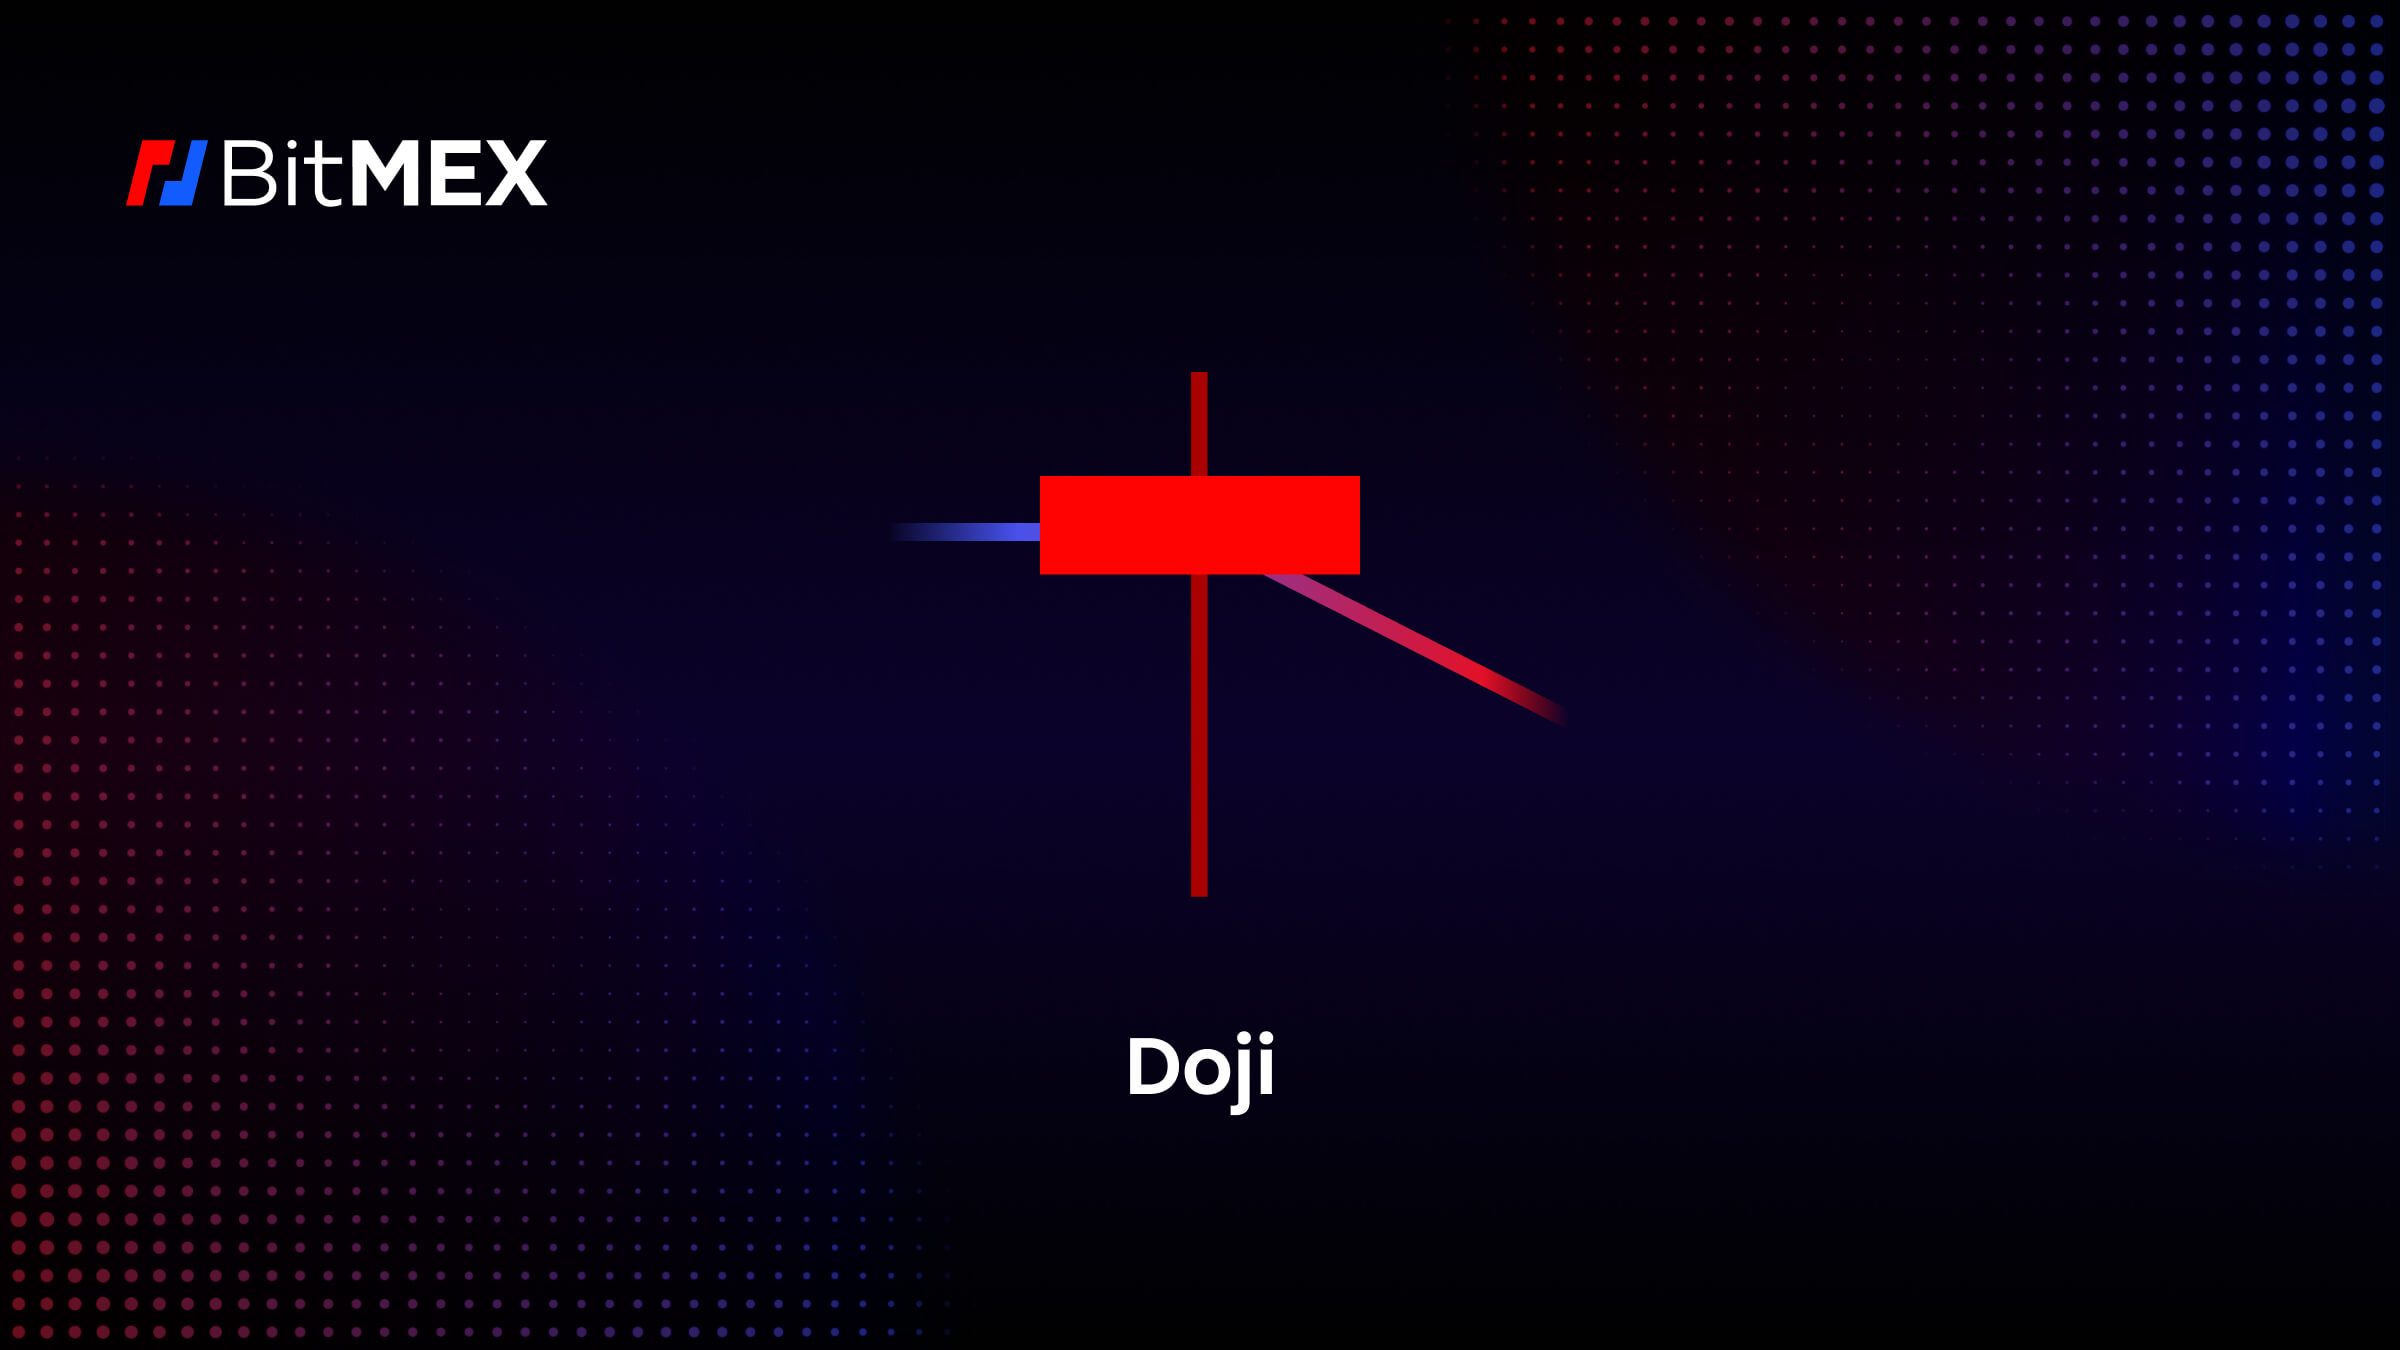
What are the Indicators of a Doji Pattern?
- Seek out a candlestick with a small or non-existent body only.
- Take note of the candlestick in these contexts :
Bullish Doji : Opening and Closing prices are close, where it is located near the lower end of the candlestick’s range
Bearish Doji : Opening and Closing prices are also close, but it is located near the upper end of the candlestick’s range
- Verify that the top and bottom shadow has a balanced length
How to Interpret the Doji Pattern?
This suggests that the fluctuations and control between the buyers and sellers in the market decide on the price outcome. The recognizable appearance of this pattern makes it accessible to beginners, providing a clear visual indication of potential trend shifts.
Additionally, advanced traders appreciate the significance of this pattern, as it illustrates a state of market uncertainty, followed by potential price reversals or continuations, which is in line with broader technical analysis and can be complementary to their trading strategies.
What is the Direction of the Doji Pattern?
Neutral Doji: In a neutral Doji, the opening and closing prices are nearly identical, resulting in a very small or non-existent body, indicating that the market is in perfect equilibrium, with neither buyers nor sellers having a significant advantage.
Bullish Doji: A bullish Doji happens when the opening price is lower than the closing price and the body of the candlestick is green, indicating that, despite some selling pressure during the session, the bulls were able to drive the price higher by the close, signalling probable bullish momentum.
Bearish Doji: A bearish Doji occurs when the initial price is greater than the closing price, and the body of the candlestick is usually red. Despite some buying interest during the timeframe, the sellers were able to pull the price lower by the close, indicating probable bearish momentum.
Validation
The candlestick that follows a Doji pattern is one of the most common ways to verify it. A bullish candlestick that closes higher than the Doji can confirm a likely bullish reversal. Similarly, a bearish candlestick that closes lower than the Doji can confirm a possible bearish reversal. This subsequent candlestick indicates a continuation in the expected direction.
Harami

A Harami is a candlestick pattern in technical analysis that is distinguished by the presence of a smaller candlestick within the body of a larger preceding candlestick.
What are the Indicators of a Harami Pattern?
- Seek out two candlesticks that are positioned similarly or exactly within the same range
- Validate that the first candlestick is green and hence closing price > opening price (bullish) or red and hence opening price > closing price
- Verify that the top and bottom shadow has a balanced length
How to Interpret the Harami Pattern?
The Harami pattern implies that the market’s volatility and influence over buyers and sellers determine the price outcome. Take a look at the context in which the harami pattern appears. It becomes more significant when it follows a well-established trend. The previous trend’s strength determines the pattern’s potential impact. It is important to determine whether the harami is bullish or bearish, which provides an insight on the market trend.
What is the Direction of the Harami Pattern?
A bullish harami happens during a downtrend and indicates a possible upward reversal. The pattern indicates that selling pressure is easing and buyers are gaining control, potentially leading to an upward turnaround or at the very least an end of the downtrend.
Validation
Volume Analysis
A spike in volume during or after the harami pattern can provide more validation for traders as a high volume can imply that market participants have more certainty towards the market.
The next article in this series will take a look at bearish candlesticks.
Theoreticals aside, if you wish to begin trading crypto derivatives or spot on BitMEX, you can find all our existing products here. For more educational resources on trading at BitMEX, particularly derivatives, visit this page.
To be the first to know about our new listings, product launches, giveaways and more, we invite you to join one of our online communities and connect with other traders. For the absolute latest, you can also follow us on Twitter, or read our blog and site announcements.
Related
The post appeared first on Blog BitMex


